Interactive Data Dashboards
MSD-LIVE users can create interactive data dashboards that allow downstream users to explore and visualize datasets without downloading the underlying data.
These dashboards provide powerful visualization capabilities, enabling users to interact with complex datasets through web-based interfaces, making data exploration accessible without requiring direct data downloads or specialized software.
Available Interactive Dashboards
lafferty-sriver-2023-downscaling-uncertainty
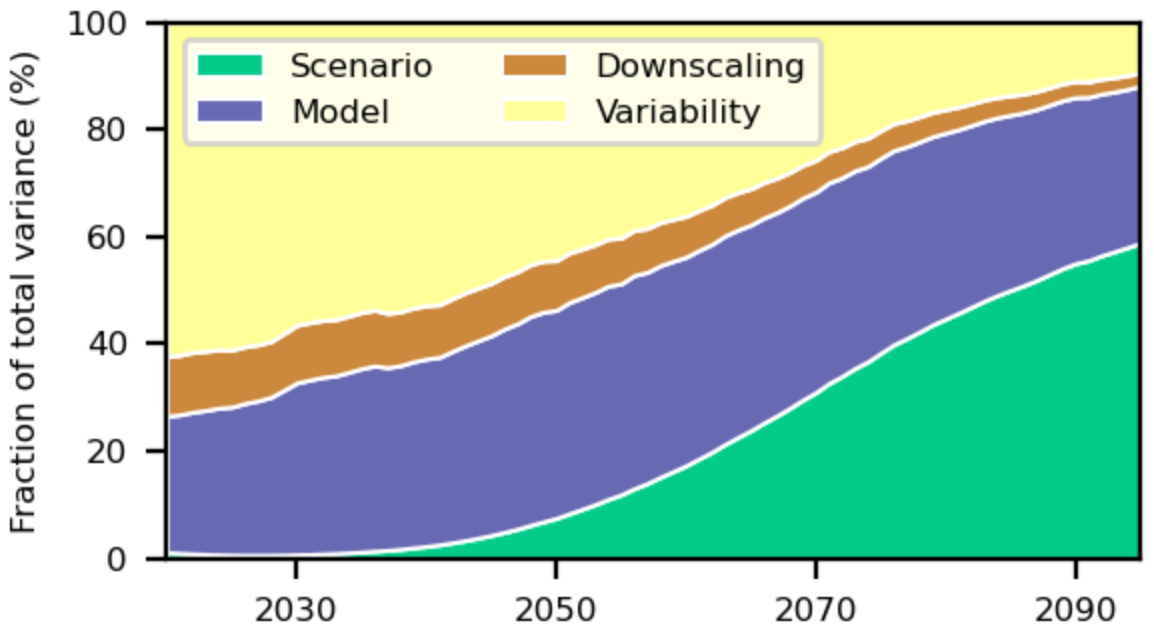
This interactive dashboard allows users to create visualizations of the dataset underpinning the Lafferty and Sriver 2023 paper published in NPJ Climate and Atmospheric Science.
ICoM RAFT Hurricane Projections Dataset
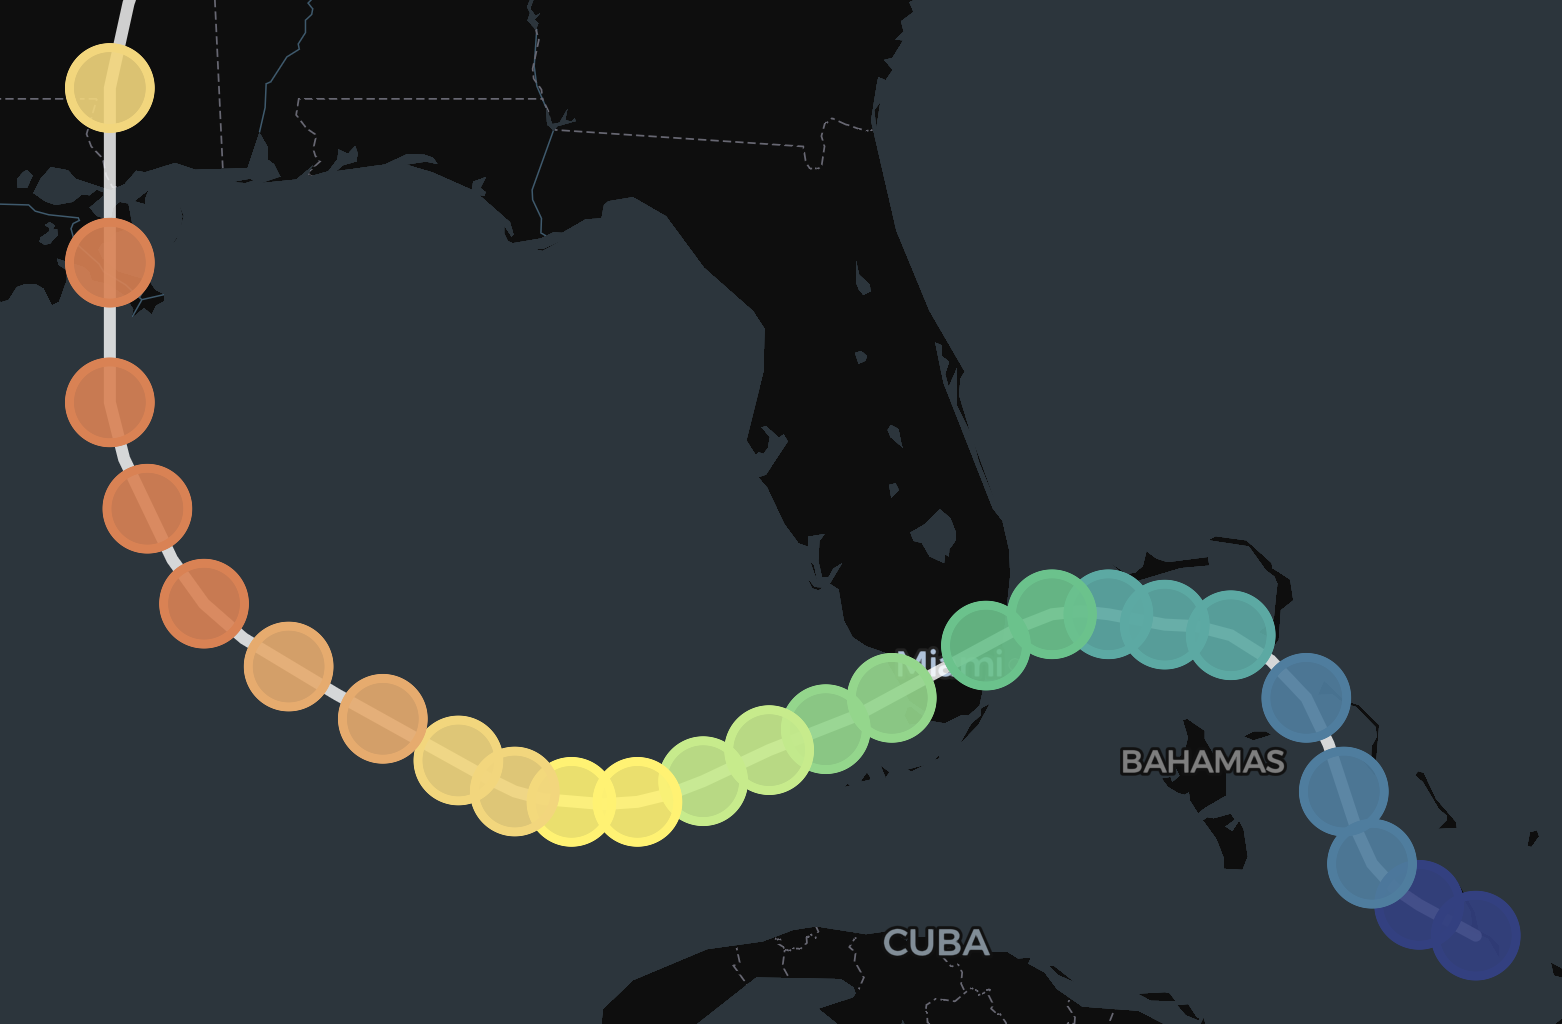
This dashboard visualizes 620 historic tropical cyclones from 1979 to 2018 replayed under eight future climate scenarios.